| Group | Transfer (€) | N | Monthly | Annual |
|---|---|---|---|---|
| Adults (18+) | 400 | 8964116 | 3.59 | 43 |
| Minors (<18) | 200 | 1675610 | 0.34 | 4 |
| Total | 10639726 | 3.92 | 47 |
Work in Progress
This article gathers a set of ideas I am still refining. Numbers will be tightened, sources added, and a general equilibrium model correctly calibrated built. It’s a draft. Thread carefully.
A Trade-off
No tax reform delivers paradise like magic. Every change carves new grooves in the economy and raises fresh complaints. The five proposals sketched above (UBI, consumption tax, welfare pruning, flat income tax, and wealth levy) are no exception. However, they bring us toward larger freedom, cleaner incentives, and sturdier social peace; clearly outweighing its negative effects. What follows is my case that these measures not only increase efficiency, they land on a moral footing that both classical liberals and social democrats can applaud. But remember: there are no solutions, there are only trade-offs.
Making Our Best
To maximize welfare government must collect taxes (for various reasons), and it must do it in the most efficient way possible. Imagine a world where government can raise money without changing anyone’s behavior. Macroeconomists call that allocation setting the first best. That is, in that situation, you would pay taxes without changing your behavior: same hours of work, same percentage of income invested, etc. Therefore, the first best is the allocation that produces the optimum amount of goods.
However, incentives matter. Taxes change your choices. Whenever a tax is implemented, people try to dodge it. So the real economic challenge is at the second best: since we must tax, how do we do it with the smallest distortions to labor, consumption and investment? The problem of “how to achieve the second best?” is called the Ramsey Problem. Let’s try to solve it.
Notice, this post isn’t about how big the public sector should be. I’m taking the governments desired budget as given. My focus is what happens next: (1) how to raise that money with the least economic drag, and (2) how to arrange redistribution without tampering growth.
Tax the Spender, Not the Producer
Not all revenue tools are created equal, so the first question is simple: which taxes do the least damage? Some levies bite harder than others. Take capital, for example: because money can cross borders at the click of a mouse, heavy capital taxes often just chase investment away. Even housing mixes up two worlds (part shelter, part wealth store) raising the awkward question of whether to treat it like a loaf of bread or a share portfolio.
What almost every economist agrees on, though, is that progressive income taxes distort more than flat sales-based levies. Progressive income schedules, with steeper and steeper brackets, shrink the payoff for each extra hour worked, nudging people toward leisure, cash-in-hand gigs, or legal loopholes. Output falls, innovation stalls, and the whole economy runs below capacity. Yes, consumption taxes still impose a deadweight loss, but compared to the drag from progressively taxing earnings, that loss is usually smaller.
Taxes, Inequality and UBI
So why do governments still lean on progressive income taxes even though they drag on growth? Remember! Every policy is a trade-off. Steeper brackets may dent output, but they also decrease the inequality that market forces naturally create. Most of us agree that a society with equality of opportunity (where talent, not family fortune, drives success) is a recipe for development. For that, we must redistribute, and the fairest place to tap is the top: the extra euro a high earner gives costs them less in real utility than it would to the median worker. Consumption taxes, by contrast, fall evenly: rich and poor pay the same rate at the checkout. Thus, they don’t help close opportunity gaps. The trade-off is clear: push harder for equality of opportunity with progressive income levies and accept a bigger hit to output, or go flatter and faster-growing with consumption taxes while increasing inequalities.
This explains why I like a UBI so much. A UBI allows us to get a progressive tax system with consumption taxes! With it, every adult receives the same lump-sum payment each month, regardless of job situation, while every child triggers a half-rate transfer so families with kids are better protected against poverty. Because I would use a consumption tax to finance the UBI, I would be be collecting money in percentage and giving it back in absolute. The transfer is in flat in euros, but the funding is flat in rate. The overall system is progressive by construction.
Consider a simple illustration. Imagine Person A earns 2000€ and Person B earns 10000€. Person A pays 10% in income taxes, but B pays 30%. Therefore, A keeps 1800€ while B keeps 7000€. This tax is clearly progressive: B earns five times more but pays 15 times more in taxes. Now switch to a world with a 35% consumption tax plus a flat 500€ universal basic income. If both spend their full pay, A nets (1 – 0.35) × €2 000 + €500 = €1 800 and B nets (1 – 0.35) × €10 000 + €500 = €7 000. Exactly the same net wage. We just achieved a progressive system with consumption taxes! Better yet, if you increase both the tax and the UBI, you can even get to a situation where a minimum wage earner ends up with more than the gross wage.
UBI: Many more advantages
And there are other advantages of UBI beyond efficiency. A second benefit is the end of paternalism. Traditional welfare programmes, that I propose to eliminate, divide help into narrow spending categories: a voucher for textbooks, a stipend for dental care, a housing allowance that can be used only in certain postcodes… Each rule carries an implicit message that beneficiaries cannot be trusted to choose for themselves, which can be soul crushing for recipients.
Third, a UBI fosters social cohesion. Today’s patchwork of exemptions and means-tested schemes breeds the feeling (often exaggerated but politically potent) that “makers” pay while “takers” collect. When everyone receives the same monthly transfer and faces the same flat consumption rate, lines between groups blur. No special carve-outs by age, occupation, or family status; no resentment about who pays for whom. The system is universal, transparent, and therefore harder to turn into an us-versus-them battleground.
Forth, there is the advantage of simplicity. That simplicity slashes bureaucracy. Dozens of overlapping programmes, each with its own forms, case-workers, and IT systems, morph into one monthly transfer. Fewer administrators, shorter queues, and less time spent navigating officialdom free up money and talent that can be used more productively elsewhere in the economy.
Finally, direct cash support tackles poverty without trapping people in it. Under today’s means-tested benefits, taking even a part-time job can wipe out the welfare support. A UBI is not withdrawn when earnings rise, so the first steps back into work always leave individuals better off. “If someone is poor, give them money” may sound blunt, but it avoids the perverse incentives that arise when aid is conditional on staying unemployed or underemployed.
One trade-off remains: by putting a guaranteed floor under everyone, the UBI may raise the reservation wage, which is the minimum pay at which people are willing to accept a job. Some individuals will choose more leisure, and that could trim labour-force participation at the margin. Yet the current system already discourages work through steep benefit claw-backs, so the net change is far from obvious. Even if a larger UBI does nudge a subset out of the labour market, the gains in productivity, dignity, simplicity, and social trust outweigh the losses for the economy as a whole.
Doing the Math
Now to the numbers for the Portuguese case. How would a UBI of 400€ per adult and 200€ per child work in Portugal?
By matching those payments to the latest population figures the gross cost comes to roughly 47 billion € a year. That headline number is around 16% of projected 2025 GDP. For reference, government revenue runs at roughly 43% of GDP.
As I said, I want the UBI to be exclusively financed by a VAT. First, we need to simplify. Tax codes are too complex, which wastes money and time (money again). My proposal keeps a single, broad consumption tax.1 Out go Portugal’s four VAT bands, all zero-rated exceptions, and the labyrinth of sector-specific deals. With every exemption and reduced rate stripped away, Portugal’s 2022 VAT (IVA) base would already be about 22% larger than today.2 Second, I propose the new VAT at 40%. To calculate the extracted revenue from this tax, I take in consideration: that consumption reduces as a result of the increase in the tax, the extra revenue from ending the exemptions, the inflation caused, and the extra revenue from the UBI spending increase.
The new, simplified VAT at 40% would raise 60 billion € in revenue.3. Because the universal basic income absorbs 47 billion € cost of the UBI, roughly €13 bn remain each year to fund other parts of the budget. Given that the current VAT collects 24 billion € a year, there is a missing piece of the budget of about 11 billion €. Part of that hole shrinks once the means-tested benefits and other small programmes, shown in Table II, disappear; those cuts save on the order of €6 billion a year, so the net extra revenue the state still needs to raise is around €5 billion.
| Programme | 2024 spending (€ m) | Treatment | Saving (€ m) |
|---|---|---|---|
| Rendimento Social de Inserção (RSI) | 328.6 | abolish | 328.6 |
| Complemento Solidário para Idosos (CSI) | 358.6 | abolish | 358.6 |
| Abono de Família | 1244.0 | abolish | 1244.0 |
| Programas de Ação Social | 2672.3 | abolish | 2672.3 |
| Apoio extraordinário à renda | 308.0 | abolish | 308.0 |
| Porta 65 Jovem & Porta 65+ | 41.4 | abolish | 41.4 |
| Tarifa Social de Eletricidade | 136.5 | abolish | 136.5 |
| Prestações de Desemprego | 1449.4 | 50 % cut | 724.7 |
| Total | 5814.1 |
But the hole grows wider once we turn to labour taxes. On the income side I keep only one low flat rate above the minimum wage and scrap every deduction, credit and special regime. (Simplify! Simplify! Simplify!) Table Table III summaries the effect: the cut would cost the Treasury about 4.8 billion € a year.
| Measure | Baseline 2024 (bn€) | After reform (bn€) | Annual impact (bn€) |
|---|---|---|---|
| IRS (current progressive) | 17.200 | 8.9 | -8.300 |
| Abolish IRS Jovem | -0.525 | 0.0 | 0.525 |
| End Resident-Non-Habitual regime | -1.741 | 0.0 | 1.741 |
| End Programa Regressar | -0.034 | 0.0 | 0.034 |
| VAT feedback effect | 0.000 | 1.2 | 1.200 |
| Total | 14.900 | 11.1 | -4.800 |
A 15% flat income-tax rate above the minimum-wage exemption (≈ €12 740 a year) trims IRS receipts from about €17.2 billion to €8.9 billion.4 However, there are two factors offsetting this loss. First, the elimination of targeted giveaways. Second, the although the headline revenue falls by 6 billion €, about 1.2 billion € of that comes back automatically because people spend part of their windfall and pay the new 40% VAT on it.5 Therefore, the current hole stands at about 9.8 billion € a year (5 + 4.8), but don’t worry, I have a plan…
Is Inequality the Same, Comrad?
Is the amount of re-distribution really the same in my system as in the current one? Even with the UBI rebate, a flat-rate consumption tax can only bend so far: its effective burden rises in a straight line with spending, not in the sharply stepped way a steep income schedule hits top earners. In short, the UBI-plus-consumption model tackles inequality on the low-middle parts of the distribution. Yet, it can’t replicate the steep extra bite traditional brackets impose on the ultra-rich; addressing that shortfall requires a different tool, which brings us to the question of taxing accumulated wealth.
My own sense of what “rich” means has shifted with every stage of life. As a kid, €100 felt like a fortune—enough for an impossible mountain of crisps. In my teens, €2 000 a month sounded positively comfortable, until I learned that—after tax—€1 600 barely stretches beyond the national average and vanishes in a single modest holiday. At university I once proclaimed in my billiards club that anyone earning €5 000 must be wealthy; João shook his head: “No, that’s just a comfortable life.” I thought he was out of touch, but today I see he was right.
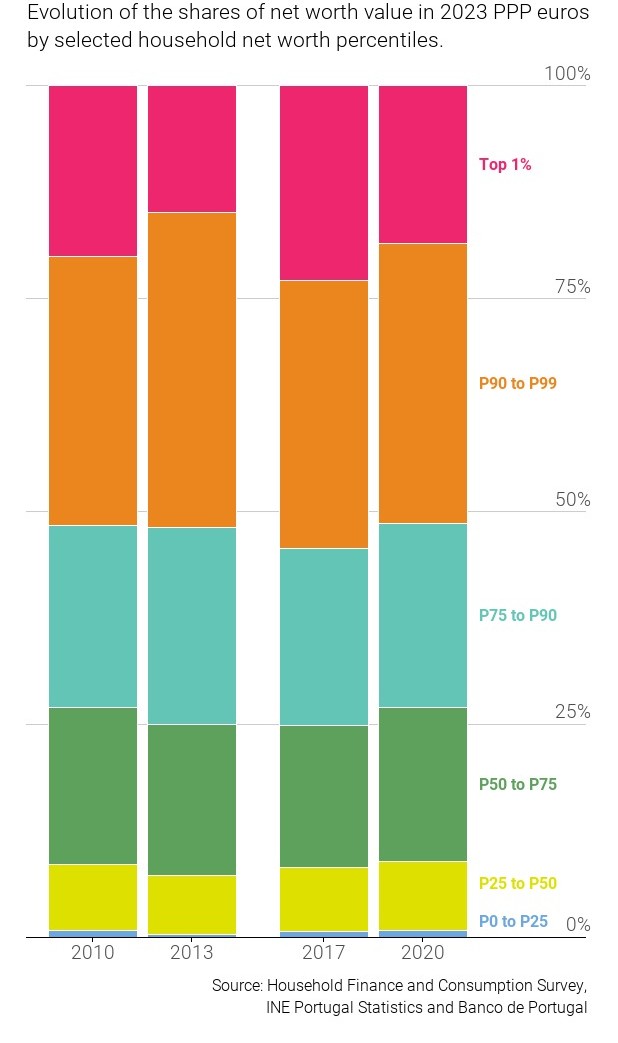
Over time I’ve learned something old-school Marxists never forgot and many market-liberals still downplay: the real chasm isn’t between high and low wages, it’s between people who already own assets and everyone else. In Portugal, Bank of Portugal data for 2020 show the bottom 25% of households controlled barely 0.8% of all net wealth, while the richest 10% held just over 50% (see Figure I). Once you’re in that top tier, compounding, property gains, and light wealth levies make it surprisingly easy to stay there; climbing up is the hard part, and our current income based taxation does not help. A salaried worker hands over more than a third of every euro in social-security contributions from the very first paycheck and then still faces income tax on top, all before a single euro can be saved. Asset owners, by contrast, see far lower effective rates on capital gains, inheritances, or real-estate appreciation.
A modest, well-designed wealth tax is the missing plank that completes both fairness and fiscal balance. By skimming a small percentage of fortunes and a sizable part when assets pass to heirs it effectively targets the one pool of resources that a flat consumption levy and a low, single-bracket income tax barely touch: accumulated capital. An exemption set until the median net worth (100 000€) shields low- and middle-class savers, while the proceeds replace the revenue lost when steep income brackets disappear.
Together, the two pillars create a self-balancing system: the consumption levy taps what people spend, while the wealth tax taps what they store. Shift the slider toward one or the other and you fine-tune society’s tilt between enjoying resources today and investing them for tomorrow. Policymakers can thus dial up consumption growth when demand is weak, or encourage long-term saving when capital is scarce; all without resorting to the blunt, distortion-heavy instruments of the old income-tax regime.
Beyond raising revenue, a moderate wealth tax can actually sharpen economic efficiency. In effect, labour and entrepreneurship keep their stronger incentives, the budget gap is closed, and the burden shifts to those best able to bear it: people whose lifestyles are financed more by yesterday’s compounding than by today’s paycheck. Moreover, the levy acts as a competence test: if you sit on property or financial assets yet cannot manage them well enough to clear the annual tax, you are nudged to sell to someone who can. Idle estates, vacant buildings, and under-used capital thus flow toward hands that put them to productive use, reinforcing both equity and growth in one stroke.
Doing the Math, Part II
It’s not all roses. I’m aware this tax makes investment less attractive. Because of the aforementioned high mobility of capital we mustn’t set a high rate. Today’s annual tax paid on property (IMI) has a maximum national value of 0.8%. Because my suggestion has a 100000€ initial exemption, I’ll settle on 1%. For the inheritances, because it’s a tax that carries very little distortions, I would set it at 10%.
| Tax | Tax base (€ bn) | Rate | Revenue (€ bn) | Share of GDP |
|---|---|---|---|---|
| Net-wealth tax (above €100 000) | 575 | 1 % | 5.8 | 2 |
| Inheritance tax (above €100 000) | 30 | 10 % | 3.0 | 1 |
| Combined yield | 8.8 | 3 |
Portuguese households own about € 855 billion in net assets. After exempting the first 100 000€ per household (roughly one-third of all wealth) the taxable stock is close to 575 billion €. A 1% annual levy therefore yields about 5.8 billion €. Annual bequests are usually around 5% of the private-wealth stock, so Portugal sees about € 43 billion pass from one generation to the next each year. Applying the same € 100 000 threshold to the recipient’s post-transfer balance removes roughly 30 percent of that flow, leaving a 30 billion € base; a 10 percent rate produces € 3 billion. These figures are static and ignore any behavioral shifts. Together, the two measures raise roughly 8.8 billion €, about 3% of GDP.
| Tax to erase | Latest annual take (€ m) | Source year |
|---|---|---|
| IMI – municipal property tax | 1562.8 | 2023 |
| AIMI – additional property levy | 147.9 | 2024 |
| IUC – annual car tax | 776.2 | 2023 |
| Total foregone revenue | 2486.9 |
However, I still have to account for the scrapping the patchwork of property levies: Portugal’s IUC on cars and the endlessly tweaked IMI on housing. Why should a family pay €200 every year for a hatchback gathering dust in the garage while a millionaire with a matching-worth pile of company shares pays nothing? IMI rates jump around by municipality, building type, and ownership quirks, spawning loopholes, appeals, and armies of assessors. Removing IMI on homes, its additional surcharge (AIMI), and the annual IUC on vehicles would cost the public purse about € 2.5 billion a year (see Table V).
So, of the 9.8 billion € still unfunded, the new wealth and inheritance taxes add back about 8.8 billion €, but scrapping existing property taxes removes a further 2.5 billion €, so roughly 3.5 billion € (1% of GDP) remains to be covered.
An Economist’s Obcession: Growth
In 1988, Robert E. Lucas wrote the “On the Mechanics of Economic Development”, published by the Journal of Monetary Economics, containing the following famous passage:
I do not see how one can look at figures like these without seeing them representing possibilities. Is there some action a government of India could take that would lead the Indian economy to grow like Indonesia’s or Egypt’s? If so, what exactly? If not, what is it about the “nature of India” that makes it so? The consequences for human welfare involved in questions like these are simply staggering: once one starts to think about them, it is hard to think about anything else.
He was referring to the compound effect of a growth rate. Let me give an example. A country starting with a GDP of 100, by growing modestly by 3% a year has a GDP of almost 2000 after 100 years!
It is my conviction that cleaning out distortions will raise Portugal’s long-run growth rate. To stay conservative, assume the reforms add only one extra percentage point to annual GDP growth. Starting from today’s 290 billion € economy, that modest lift is enough to erase the remaining 3.5 billion € funding gap in just four years. Better yet: every year after that, the faster trend turns into a permanent surplus for debt reduction or further tax cuts.6
Conclusion
A single-rate VAT that funds a universal basic income, a flat 15% IRS, trimmed welfare, and a modest 1% wealth–10% inheritance levy together replace today’s tangle of brackets, carve-outs, and property surcharges with one transparent system that still protects the vulnerable. In short: freer choices, simpler rules, fairer burdens, and faster growth, all within a fiscally balanced framework.
Footnotes
And also I would like to keep the existing Pigouvian taxes, like gasoline, tocacoo and sugar.↩︎
Those carve-outs currently cost the treasury roughly 22.2% of potential revenue, refereed to as the “actionable policy gap”.↩︎
I’m using the partial equilibrium equation: \[ \text{VAT}_{40} = \tau\!\left[(1+g)B\bigl(1+\eta\Delta p\bigr) + \frac{\text{MPC}\times\text{UBI}}{1+\tau}\right] \] \[ \begin{aligned} \tau &= 0.40 &&\text{(new single rate)}\\[2pt] g &= 0.222 &&\text{(22\% base widening once tiers/exemptions vanish)}\\ B &= \dfrac{\text{VAT}_{2022}}{0.23}= \dfrac{24}{0.23}\approx 104\ \text{bn} &&\text{(current VAT base)}\\ \eta &= -0.25 &&\text{(aggregate price-elasticity of real consumption)}\\ \Delta p &= \dfrac{1+\tau}{1+0.23}-1 = \dfrac{1.40}{1.23}-1 \approx 0.138 &&\text{(13.8\% price jump)}\\ \text{MPC}&= 0.8 &&\text{(fraction of the UBI that is spent)}\\ \text{UBI}&= 47\ \text{bn} &&\text{(gross cost)} \end{aligned} \] Plugging the values in, \[ \text{VAT}_{40} = 0.40\Bigl[1.222\times104\times0.9655 + \tfrac{0.8\times47}{1.40}\Bigr] \;\approx\; 60\ \text{bn}. \]↩︎
The new figure is obtained by applying 15% to roughly €110 billion of labour income after exemption and then adding a 10% base-broadening effect, consistent with an elasticity of taxable income of 0.4.↩︎
With a marginal propensity to consume of 0.7, households spend an extra €4.2 bn. Formula: \(\displaystyle \text{VAT}_{\text{extra}} = \frac{\tau}{1+\tau}\times\text{MPC}\times\Delta\text{DI} = \frac{0.40}{1.40}\times0.7\times6 \approx 1.2\text{ bn}\). Here \(\tau\) is the VAT rate, MPC is 0.7 and \(\Delta\text{DI}=6\text{ bn}\) is the jump in disposable income from the tax cuts.↩︎
Let \(Y_0 = 290\;\text{bn}\) and let revenue remain one-third of GDP after the reform. With an extra 1 pp growth, GDP after \(t\) years is \(Y_t = 290(1.01)^t\). Incremental revenue is \(0.33 \times 290\bigl[(1.01)^t - 1\bigr]\). Setting this equal to the € 3.5 bn gap yields \((1.01)^t - 1 = 3.5/(0.33 \times 290) \approx 0.037\), so \(t = \ln(1.037)/\ln(1.01) \approx 3.6\) years.↩︎